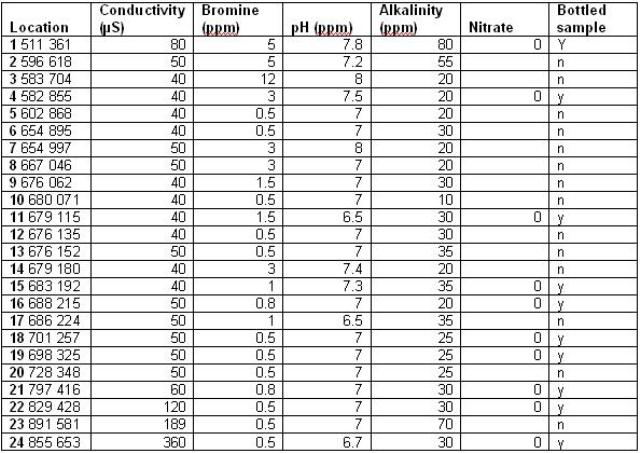
Table 1. Data collected on Kesagami River, Kesagami Lake, and Little Kesagami
River.
As indicated on
figure 1. the Kesagami River water shed (from Kesagami Lake to James Bay) is
roughly 160km North to South, by 55km East to West. The area of the water shed
is nearly twice that of the entire province of Prince Edward Island. With a
water drawing area of such vastness, the river is vulnerable to environmental
impacts from water systems far exceeding the area of Kesagami Provincial Park.