Methodology:
All data and samples were collected in Kesagami Provincial Park which encompasses
Kesagami Lake and River but excludes Little Kesagami River. Specifically, conductivity,
bromine, pH, and alkalinity, levels were determined at twenty-four sites throughout
the route and ten water samples with corresponding nitrate levels were collected
and stored for more in-depth analysis.
Additionally, all sampling locations were marked on maps and grid referenced, and an accompanying digital picture was taken of each collection site. Brief visual observations of water colour and flow were also compiled. The conductivity readings were collected using a hand held, battery powered, electronic conductivity probe. The bromine, pH, and alkalinity levels were all determined using spa & pool test strips, which produced three separate colours when placed in contact with the water corresponding to a colour chart with respective values for each factor on the side of the test strips' water-tight bottle.
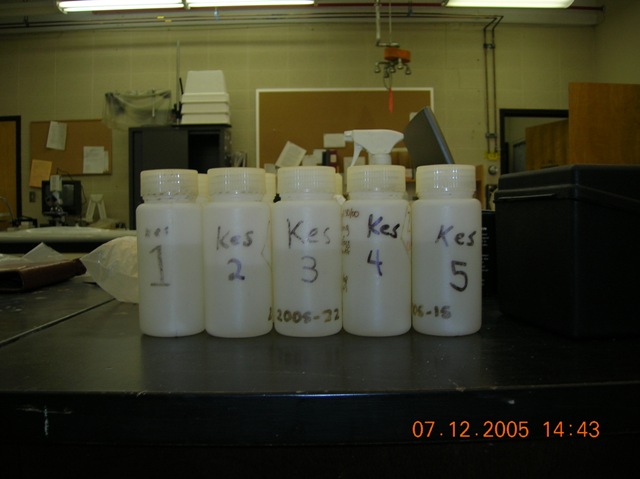
The nitrate levels were determined using a nitrate testing kit, which involved a chemical reaction with the water producing a shade of magenta representing the nitrate component in the water as determined with reference to a colour and value chart. The water samples were obtained using ten sterilized and water-tight plastic bottles (Figure 1.1 & 1.2). The bottles were first rinsed with river water at the chosen sample location, then filled roughly 2/3 full and re-sealed.
In order to determine the size of the water shed flowing into Kesagami River from Lake Kesagami to James Bay, a large map was taped together using photocopied topographical maps (Figure 1.3-1.6) provided by the Acadia University Geology Department. The outline of the water shed was then carefully drawn onto the map. A computer image of the canoe route and the corresponding water shed was then created using Google Earth, and the water shed and several other key features of the project were drawn onto it with the aid of the paper map (Figure 1. Index page).
Figure 1.1. Water sampling sealable plastic bottles.
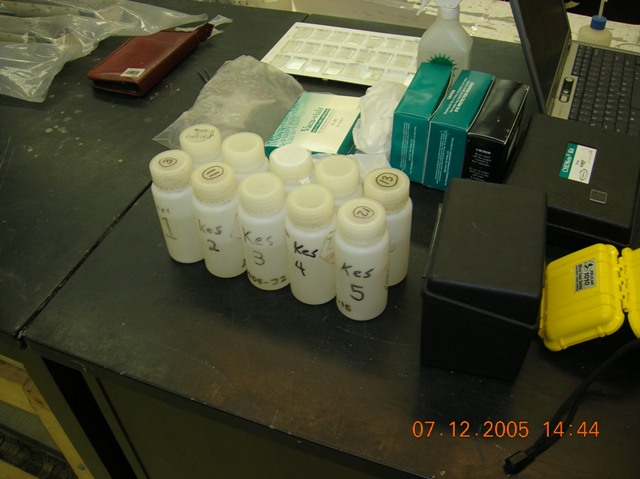
Figure 1.2. Water sampling sealable plastic bottles.

Figure 1.3. Water shed map upper portion (water shed outlined in red)
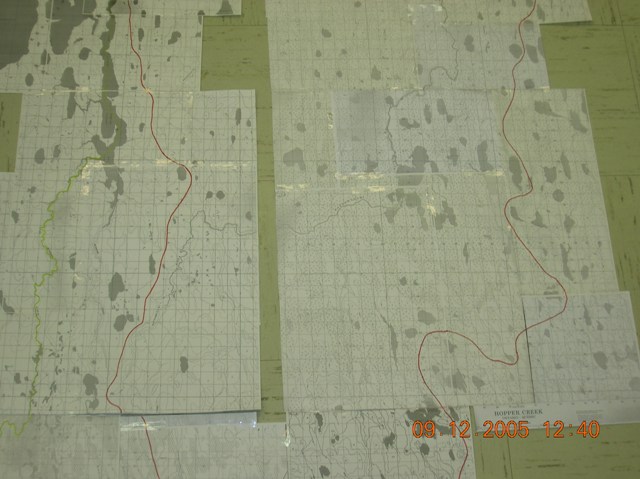
Figure 1.4. Water shed map middle portion.
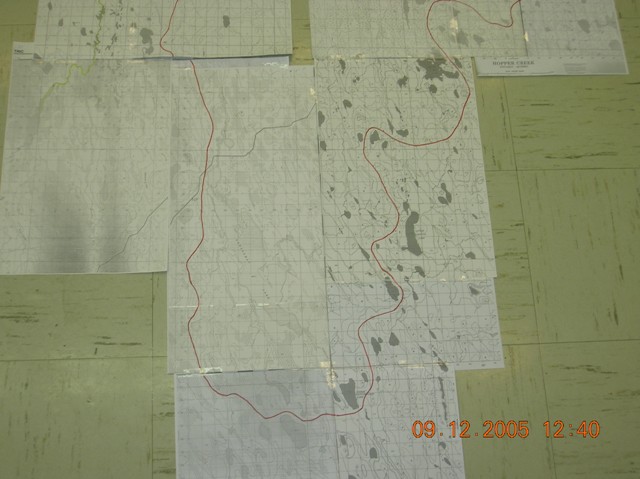
Figure 1.5. Water shed map middle portion.
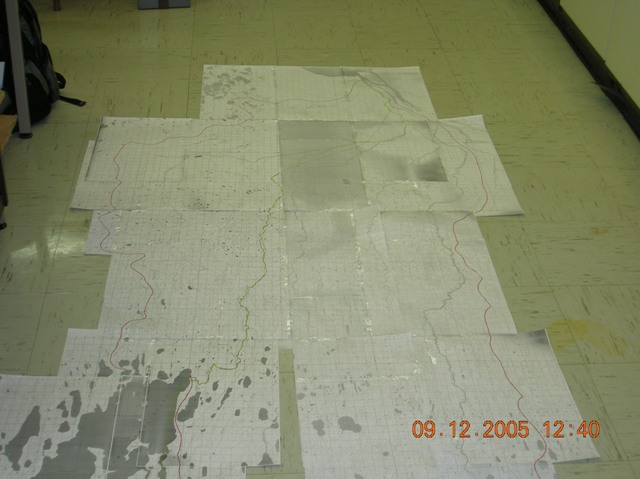
Figure 1.6. Water shed map in its entireity.